CASE STUDY: JMP022
Archosaurs
The Relationship Between Body Size and Brain Size
by Dr. DeWayne Derryberry, Idaho State University, Department of Mathematics
Key Concepts: Histogram and summary statistics, fitting a regression line, log transformations, residual plots, interpreting regression output and parameter estimates, inverse transformations

Dr. DeWayne Derryberry
Idaho State University
Objective
Analyze data on the brain and body weight of different dinosaur species to determine if a proposed statistical model performs well at describing the relationship and use the model to predict brain weight based on body weight.
Background
Reptiles of the subclass Archosauria include the now extinct dinosaurs and pterosaurs (flying or gliding dinosaurs) as well as birds and crocodiles. For any subclass of animals, although individual species vary greatly in size, it has been found that there is a relatively consistent relationship between body size and brain size.
In “Relative Brain Size and Behavior of Archosaurian Reptiles” (Annual Review of Ecology and Systematics 1977, by James A. Hopson) the author cites a widely observed power law relationship:
𝐵𝑟𝑎𝑖𝑛 𝑤𝑔𝑡 = 𝑘 × (𝐵𝑜𝑑𝑦 𝑤𝑔𝑡) 2/3
Using logarithms, this can be transformed into a linear relationship:
𝐿𝑜𝑔(𝐵𝑟𝑎𝑖𝑛 𝑤𝑔𝑡) = 𝐿𝑜𝑔(𝑘)+ 0.67 × 𝐿𝑜𝑔(𝐵𝑜𝑑𝑦 𝑤𝑔𝑡)
It should be noted we would expect “smart” animals, such as the mammals, to differ from “dumb” animals, such as the reptiles, by having a linear relationship with a larger intercept. In other words, “k” would be larger for mammals than reptiles. Also, it does not matter which logarithmic transformation we use (common logs, natural logs or any others), but we will use the natural log.
Power law models are based on the relationship 𝑦 = 𝑎𝑥 b , which can be restated as a linear relationship log(𝑦) = log(𝑎) + 𝑏 × log(𝑥) using a logarithmic transformation. Power law models represent scale invariant relationships, that is, relationships thought to hold in the same manner for very large and very small observed values. For example, in biology the relationship between habitat area and number of species fits a power law model quite well (see Case 1 and Exercise 22 from Chapter 8 of The Statistical Sleuth, Second Edition, Ramsey and Schafer, 2002). A Web search on power law models will result in dozens of examples, taken mostly from physics and engineering.
This is a typical example of a power law model. Although reptiles vary greatly in size, we would expect about the same proportion of their mass to be devoted to brain size. We expect the same for mammals, except we expect the brains of mammals to be bigger than the reptile of the same overall mass, hence the greater value for “k”.
The Task
Determine whether a power law model fits the data. In other words:
- Does it make sense to take logarithmic transformations of body weight and brain weight in order to perform a linear regression?
- Are the assumptions of the linear regression met?
- Is our final model a good fit to the data?
- Does the slope of 2/3 actually seem to match the data?
Other questions of interest:
- How do we make predictions in a power law model?
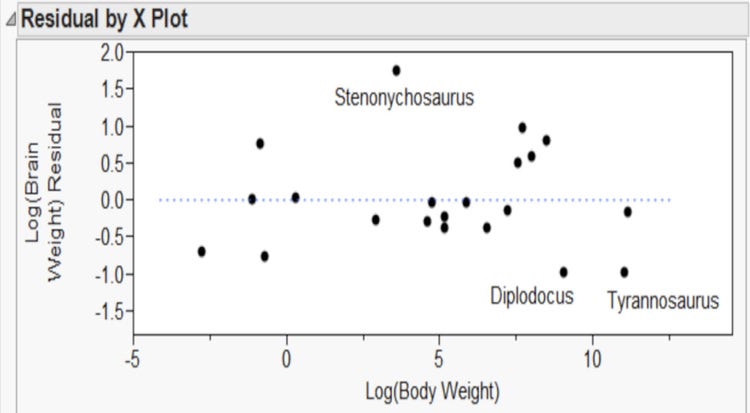
- What do large positive and negative residuals mean in this context?