Publication date: 02/06/2025
Example of a Scatterplot Matrix in Graph Builder
You can make the same plots shown in the example above using Graph Builder
1. Select Help > Sample Data Folder and open Students.jmp.
2. Select Graph > Graph Builder.
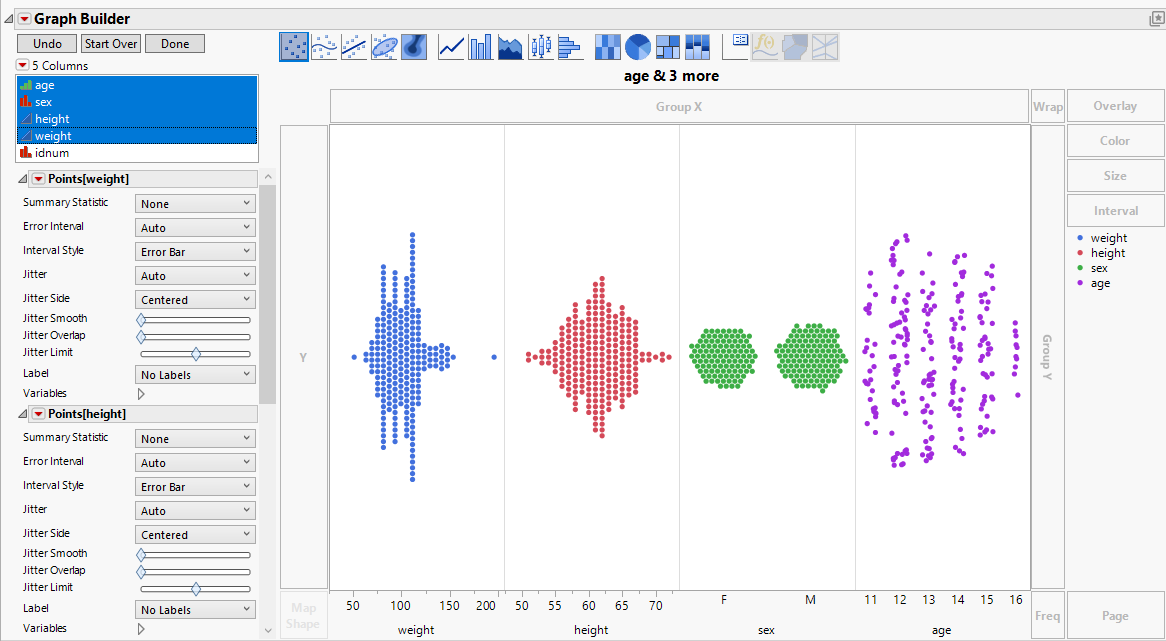
3. Select age, sex, height, and weight, hold down the Shift key, and then click the X zone.
Figure 6.4 Adding Variables to the X Zone
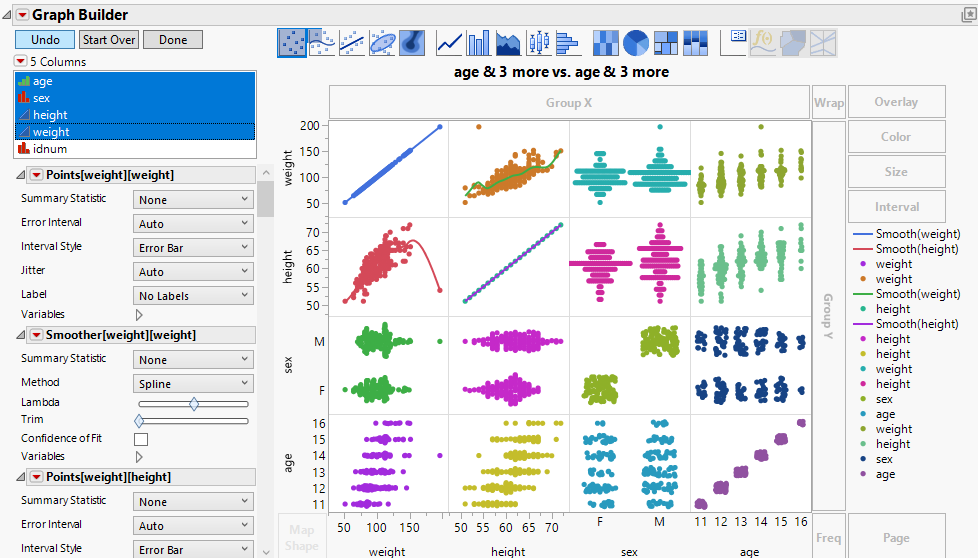
4. Select age, sex, height, and weight, hold down the Shift key, and then click the Y zone.
Figure 6.5 Adding Variables to the Y Zone
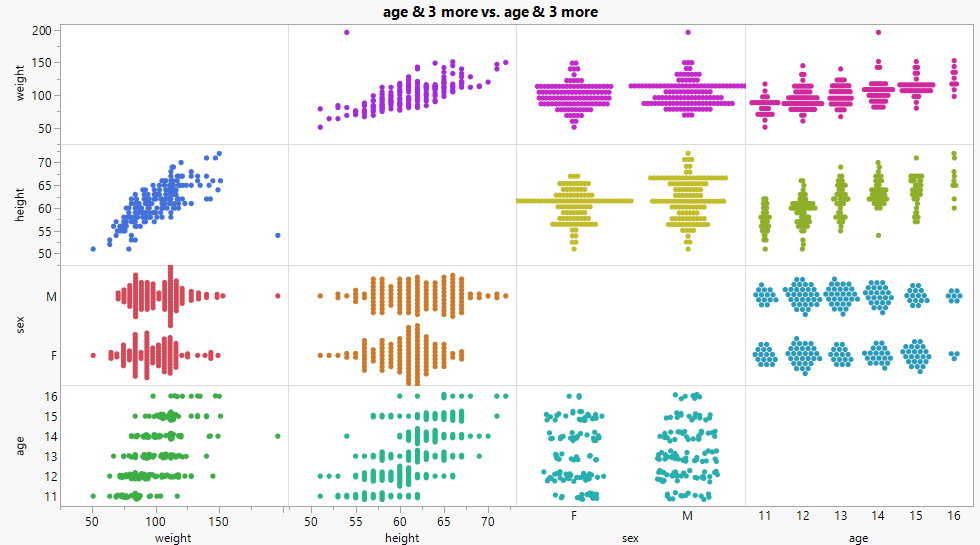
5. Click the shaded area on the Smoother icon ![]() to deselect it.
to deselect it.
6. Right click the Legend and select Hide Legend.
7. Right click the diagonal panel and select Points > Remove.
8. Click Done.
Figure 6.6 Scatterplot Matrix in Graph Builder
Want more information? Have questions? Get answers in the JMP User Community (community.jmp.com).